
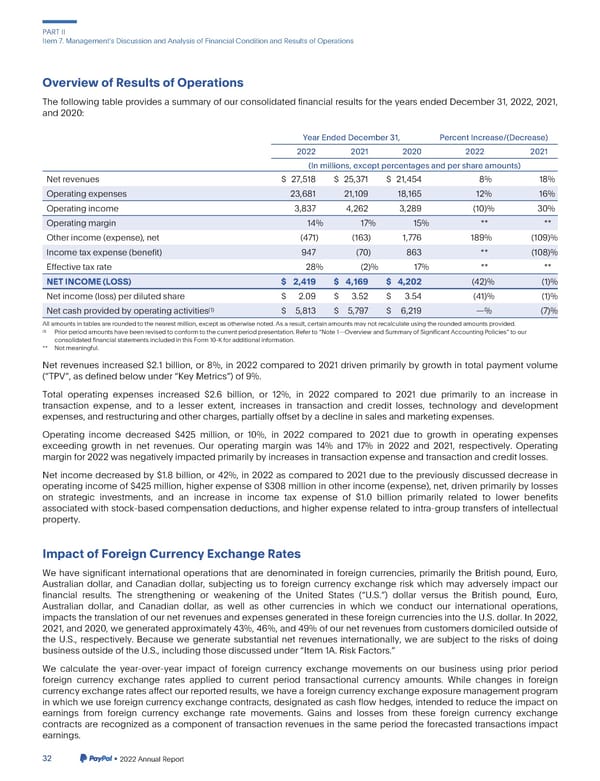
PARTII Item7. ManagementsDiscussionandAnalysisofFinancialConditionandResultsofOperations OverviewofResultsofOperations Thefollowing table provides a summary of our consolidated financial results for the years ended December 31, 2022, 2021, and2020: YearEndedDecember31, PercentIncrease/(Decrease) 2022 2021 2020 2022 2021 (In millions, except percentagesand per share amounts) Netrevenues $ 27,518 $ 25,371 $ 21,454 8% 18% Operatingexpenses 23,681 21,109 18,165 12% 16% Operatingincome 3,837 4,262 3,289 (10)% 30% Operatingmargin 14% 17% 15% ** ** Otherincome(expense),net (471) (163) 1,776 189% (109)% Incometaxexpense(benefit) 947 (70) 863 ** (108)% Effective tax rate 28% (2)% 17% ** ** NETINCOME(LOSS) $ 2,419 $ 4,169 $ 4,202 (42)% (1)% Netincome(loss)perdilutedshare $ 2.09 $ 3.52 $ 3.54 (41)% (1)% (1) $ 5,813 $ 5,797 $ 6,219 —% (7)% Netcashprovidedbyoperatingactivities All amountsintablesareroundedtothenearestmillion,exceptasotherwisenoted.Asaresult,certainamountsmaynotrecalculateusingtheroundedamountsprovided. (1) Prior period amountshavebeenrevisedtoconformtothecurrentperiodpresentation.Referto“Note1—OverviewandSummaryofSignificantAccountingPolicies”toour consolidatedfinancialstatementsincludedinthisForm10-Kforadditionalinformation. ** Notmeaningful. Net revenues increased $2.1 billion, or 8%, in 2022 compared to 2021 driven primarily by growth in total payment volume (“TPV”, as defined below under “Key Metrics”) of 9%. Total operating expenses increased $2.6 billion, or 12%, in 2022 compared to 2021 due primarily to an increase in transaction expense, and to a lesser extent, increases in transaction and credit losses, technology and development expenses,andrestructuringandothercharges,partiallyoffsetbyadeclineinsalesandmarketingexpenses. Operating income decreased $425 million, or 10%, in 2022 compared to 2021 due to growth in operating expenses exceeding growth in net revenues. Our operating margin was 14% and 17% in 2022 and 2021, respectively. Operating marginfor2022wasnegativelyimpactedprimarilybyincreasesintransactionexpenseandtransactionandcreditlosses. Net income decreased by $1.8 billion, or 42%, in 2022 as compared to 2021 due to the previously discussed decrease in operating income of $425 million, higher expense of $308 million in other income (expense), net, driven primarily by losses on strategic investments, and an increase in income tax expense of $1.0 billion primarily related to lower benefits associated with stock-based compensation deductions, and higher expense related to intra-group transfers of intellectual property. ImpactofForeignCurrencyExchangeRates Wehave significant international operations that are denominated in foreign currencies, primarily the British pound, Euro, Australian dollar, and Canadian dollar, subjecting us to foreign currency exchange risk which may adversely impact our financial results. The strengthening or weakening of the United States (“U.S.”) dollar versus the British pound, Euro, Australian dollar, and Canadian dollar, as well as other currencies in which we conduct our international operations, impactsthetranslationof our net revenues and expensesgeneratedin theseforeigncurrenciesinto the U.S. dollar. In 2022, 2021, and 2020, we generatedapproximately43%, 46%, and49%ofournetrevenuesfromcustomersdomiciledoutsideof the U.S., respectively. Because we generate substantial net revenues internationally, we are subject to the risks of doing businessoutsideoftheU.S.,includingthosediscussedunder“Item1A.RiskFactors.” We calculate the year-over-year impact of foreign currency exchange movements on our business using prior period foreign currency exchange rates applied to current period transactional currency amounts. While changes in foreign currencyexchangeratesaffectourreportedresults,wehaveaforeigncurrencyexchangeexposuremanagementprogram in which we use foreign currency exchange contracts, designated as cash flow hedges, intended to reduce the impact on earnings from foreign currency exchange rate movements. Gains and losses from these foreign currency exchange contracts are recognized as a component of transaction revenues in the same period the forecasted transactions impact earnings. 32 •2022AnnualReport
 2023 Annual Report Page 179 Page 181