
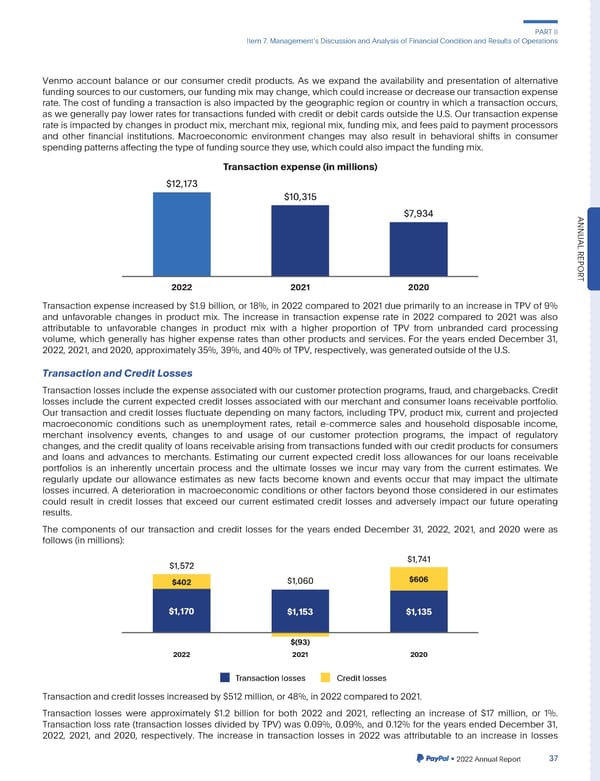
PARTII Item7. ManagementsDiscussionandAnalysisofFinancialConditionandResultsofOperations Venmo account balance or our consumer credit products. As we expand the availability and presentation of alternative funding sourcesto our customers,our funding mix may change,whichcouldincreaseordecreaseourtransactionexpense rate. The cost of funding a transaction is also impacted by the geographic region or country in which a transaction occurs, as we generally pay lower rates for transactions funded with credit or debit cards outside the U.S. Our transaction expense rate is impacted by changes in product mix, merchant mix, regional mix, funding mix, and fees paid to payment processors and other financial institutions. Macroeconomic environment changes may also result in behavioral shifts in consumer spendingpatternsaffectingthetypeoffundingsourcetheyuse,whichcouldalsoimpactthefundingmix. Transaction expense (in millions) $12,173 $10,315 $7,934 ANNU AL REPOR 2022 2021 2020 T Transaction expense increased by $1.9 billion, or 18%, in 2022 compared to 2021 due primarily to an increase in TPV of 9% and unfavorable changes in product mix. The increase in transaction expense rate in 2022 compared to 2021 was also attributable to unfavorable changes in product mix with a higher proportion of TPV from unbranded card processing volume, which generally has higher expense rates than other products and services. For the years ended December 31, 2022,2021,and2020,approximately35%,39%,and40%ofTPV,respectively,wasgeneratedoutsideoftheU.S. TransactionandCreditLosses Transaction losses include the expense associated with our customer protection programs, fraud, and chargebacks.Credit losses include the current expected credit losses associated with our merchant and consumer loans receivable portfolio. Our transaction and credit losses fluctuate depending on many factors, including TPV, product mix, current and projected macroeconomic conditions such as unemployment rates, retail e-commerce sales and household disposable income, merchant insolvency events, changes to and usage of our customer protection programs, the impact of regulatory changes,andthecreditquality of loans receivablearising from transactionsfunded with our credit products for consumers and loans and advances to merchants. Estimating our current expected credit loss allowances for our loans receivable portfolios is an inherently uncertain process and the ultimate losses we incur may vary from the current estimates. We regularly update our allowance estimates as new facts become known and events occur that may impact the ultimate losses incurred. A deterioration in macroeconomic conditions or other factors beyond those considered in our estimates could result in credit losses that exceed our current estimated credit losses and adversely impact our future operating results. The components of our transaction and credit losses for the years ended December 31, 2022, 2021, and 2020 were as follows (in millions): $1,572 $1,741 $402 $1,060 $606 $1,170 $1,153 $1,135 $(93) 2022 2021 2020 Transaction losses Credit losses Transactionandcreditlossesincreasedby$512million,or48%,in2022comparedto2021. Transaction losses were approximately $1.2 billion for both 2022 and 2021, reflecting an increase of $17 million, or 1%. Transaction loss rate (transaction losses divided by TPV) was 0.09%, 0.09%, and 0.12% for the years ended December 31, 2022, 2021, and 2020, respectively. The increase in transaction losses in 2022 was attributable to an increase in losses •2022AnnualReport 37
 2023 Annual Report Page 184 Page 186