
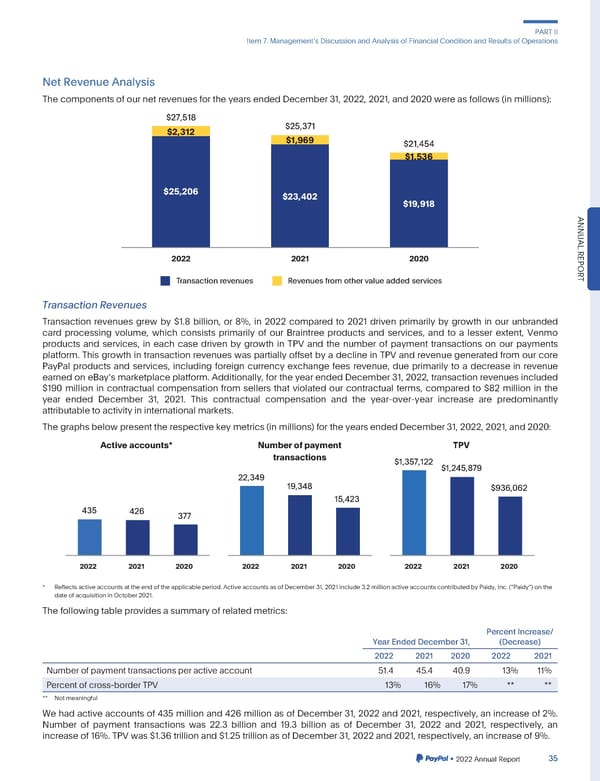
PARTII Item7. ManagementsDiscussionandAnalysisofFinancialConditionandResultsofOperations NetRevenueAnalysis ThecomponentsofournetrevenuesfortheyearsendedDecember31,2022,2021,and2020wereasfollows(inmillions): $27,518 $2,312 $25,371 $1,969 $21,454 $1,536 $25,206 $23,402 $19,918 ANNU AL 2022 2021 2020 REPOR Transaction revenues Revenues from other value added services T TransactionRevenues Transaction revenues grew by $1.8 billion, or 8%, in 2022 compared to 2021 driven primarily by growth in our unbranded card processing volume, which consists primarily of our Braintree products and services, and to a lesser extent, Venmo products and services, in each case driven by growth in TPV and the number of payment transactions on our payments platform. This growth in transaction revenues was partially offset by a decline in TPV and revenue generated from our core PayPal products and services, including foreign currency exchange fees revenue, due primarily to a decrease in revenue earnedoneBaysmarketplaceplatform.Additionally,for the year endedDecember31, 2022, transactionrevenuesincluded $190 million in contractual compensation from sellers that violated our contractual terms, compared to $82 million in the year ended December 31, 2021. This contractual compensation and the year-over-year increase are predominantly attributable to activity in international markets. Thegraphsbelowpresenttherespectivekeymetrics(inmillions)fortheyearsendedDecember31,2022,2021,and2020: Active accounts* Number of payment TPV transactions $1,357,122 $1,245,879 22,349 19,348 $936,062 15,423 435 426 377 2022 2021 2020 2022 2021 2020 2022 2021 2020 * Reflects active accountsat the end of the applicable period. Active accountsas of December31, 2021include3.2 millionactive accountscontributedby Paidy, Inc.(“Paidy”) on the dateofacquisitioninOctober2021. Thefollowingtableprovidesasummaryofrelatedmetrics: PercentIncrease/ YearEndedDecember31, (Decrease) 2022 2021 2020 2022 2021 Numberofpaymenttransactionsperactiveaccount 51.4 45.4 40.9 13% 11% Percentofcross-borderTPV 13% 16% 17% ** ** ** Notmeaningful Wehadactiveaccountsof435millionand426millionasof December31, 2022and2021, respectively,an increaseof 2%. Number of payment transactions was 22.3 billion and 19.3 billion as of December 31, 2022 and 2021, respectively, an increaseof16%.TPVwas$1.36trillionand$1.25trillionasofDecember31,2022and2021,respectively,anincreaseof9%. •2022AnnualReport 35
 2023 Annual Report Page 182 Page 184