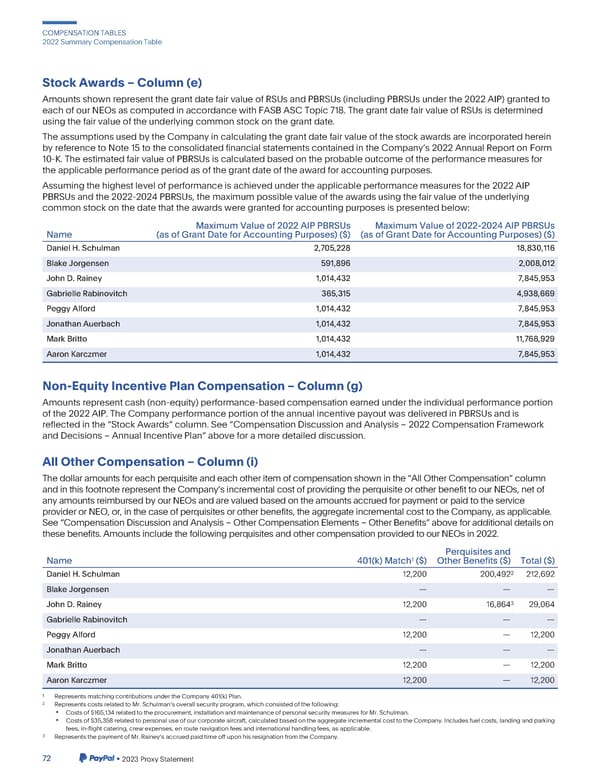
COMPENSATIONTABLES 2022SummaryCompensationTable StockAwards–Column(e) AmountsshownrepresentthegrantdatefairvalueofRSUsandPBRSUs(includingPBRSUsunderthe2022AIP)grantedto eachofourNEOsascomputedinaccordancewithFASBASCTopic718.ThegrantdatefairvalueofRSUsisdetermined usingthefair value of the underlying commonstockonthegrantdate. TheassumptionsusedbytheCompanyincalculatingthegrantdatefairvalueofthestockawardsareincorporatedherein byreferencetoNote15totheconsolidatedfinancialstatementscontainedintheCompanys2022AnnualReportonForm 10-K. The estimatedfair value of PBRSUs is calculatedbasedon the probableoutcomeof theperformancemeasuresfor theapplicableperformanceperiodasofthegrantdateoftheawardforaccountingpurposes. Assumingthehighestlevelofperformanceisachievedundertheapplicableperformancemeasuresforthe2022AIP PBRSUsandthe2022-2024PBRSUs,themaximumpossiblevalueoftheawardsusingthefairvalueoftheunderlying commonstockonthedatethattheawardsweregrantedforaccountingpurposesispresentedbelow: MaximumValueof2022AIPPBRSUs MaximumValueof2022-2024AIPPBRSUs Name (as of Grant Date for Accounting Purposes)($) (as of Grant Date for Accounting Purposes)($) DanielH.Schulman 2,705,228 18,830,116 BlakeJorgensen 591,896 2,008,012 JohnD.Rainey 1,014,432 7,845,953 Gabrielle Rabinovitch 365,315 4,938,669 PeggyAlford 1,014,432 7,845,953 JonathanAuerbach 1,014,432 7,845,953 MarkBritto 1,014,432 11,768,929 AaronKarczmer 1,014,432 7,845,953 Non-EquityIncentivePlanCompensation–Column(g) Amountsrepresentcash(non-equity)performance-basedcompensationearnedundertheindividualperformanceportion of the 2022 AIP. The CompanyperformanceportionoftheannualincentivepayoutwasdeliveredinPBRSUsandis reflectedin the “Stock Awards”column.See“CompensationDiscussionandAnalysis–2022CompensationFramework andDecisions–AnnualIncentivePlan”aboveforamoredetaileddiscussion. All OtherCompensation–Column(i) Thedollaramountsforeachperquisiteandeachotheritemofcompensationshowninthe“AllOtherCompensation”column andinthisfootnoterepresenttheCompanysincrementalcostofprovidingtheperquisiteorotherbenefittoourNEOs,netof anyamountsreimbursedbyourNEOsandarevaluedbasedontheamountsaccruedforpaymentorpaidtotheservice provider or NEO, or, in the case of perquisites or other benefits, the aggregate incremental cost to the Company, as applicable. See“CompensationDiscussionandAnalysis–OtherCompensationElements–OtherBenefits”aboveforadditionaldetailson thesebenefits. AmountsincludethefollowingperquisitesandothercompensationprovidedtoourNEOsin2022. Perquisitesand 1 Name 401(k) Match ($) OtherBenefits($) Total ($) 2 DanielH.Schulman 12,200 200,492 212,692 BlakeJorgensen ——— 3 JohnD.Rainey 12,200 16,864 29,064 Gabrielle Rabinovitch ——— PeggyAlford 12,200 — 12,200 JonathanAuerbach ——— MarkBritto 12,200 — 12,200 AaronKarczmer 12,200 — 12,200 1 RepresentsmatchingcontributionsundertheCompany401(k)Plan. 2 RepresentscostsrelatedtoMr.Schulmansoverallsecurityprogram,whichconsistedofthefollowing: • Costsof$165,134relatedtotheprocurement,installationandmaintenanceofpersonalsecuritymeasuresforMr.Schulman. • Costsof$35,358relatedtopersonaluseofourcorporateaircraft,calculatedbasedontheaggregateincrementalcosttotheCompany.Includesfuelcosts,landingandparking fees, in-flight catering, crew expenses, en route navigation fees and internationalhandling fees, as applicable. 3 RepresentsthepaymentofMr.RaineysaccruedpaidtimeoffuponhisresignationfromtheCompany. 72 •2023ProxyStatement
 2023 Annual Report Page 79 Page 81