
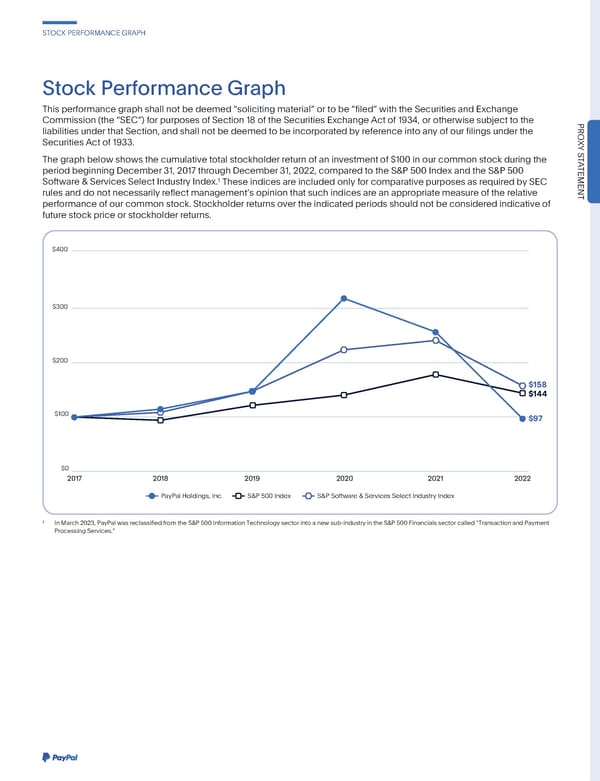
STOCKPERFORMANCEGRAPH StockPerformanceGraph This performancegraphshallnotbedeemed“solicitingmaterial”ortobe“filed”withtheSecuritiesandExchange Commission(the“SEC”)forpurposesofSection18oftheSecuritiesExchangeActof1934,orotherwisesubjecttothe liabilities under that Section, and shall not be deemed to be incorporatedby referenceinto any of our filings under the PRO Securities Act of 1933. XY S T Thegraphbelowshowsthecumulativetotalstockholderreturnofaninvestmentof$100inourcommonstockduringthe A periodbeginningDecember31,2017throughDecember31,2022,comparedtotheS&P500IndexandtheS&P500 TEMENT 1 Software&ServicesSelectIndustryIndex. TheseindicesareincludedonlyforcomparativepurposesasrequiredbySEC rules and do not necessarilyreflect managementsopinionthatsuchindicesareanappropriatemeasureoftherelative performanceofourcommonstock.Stockholderreturnsovertheindicatedperiodsshouldnotbeconsideredindicativeof future stock price or stockholder returns. $400 $300 $200 $158 $144 $100 $97 $0 2017 2018 2019 2020 2021 2022 PayPal Holdings, Inc. S&P 500 Index S&P Software & Services Select Industry Index 1 In March2023,PayPalwasreclassifiedfromtheS&P500InformationTechnologysectorintoanewsub-industryintheS&P500Financialssectorcalled“TransactionandPayment ProcessingServices.”
 2023 Annual Report Page 272 Page 274