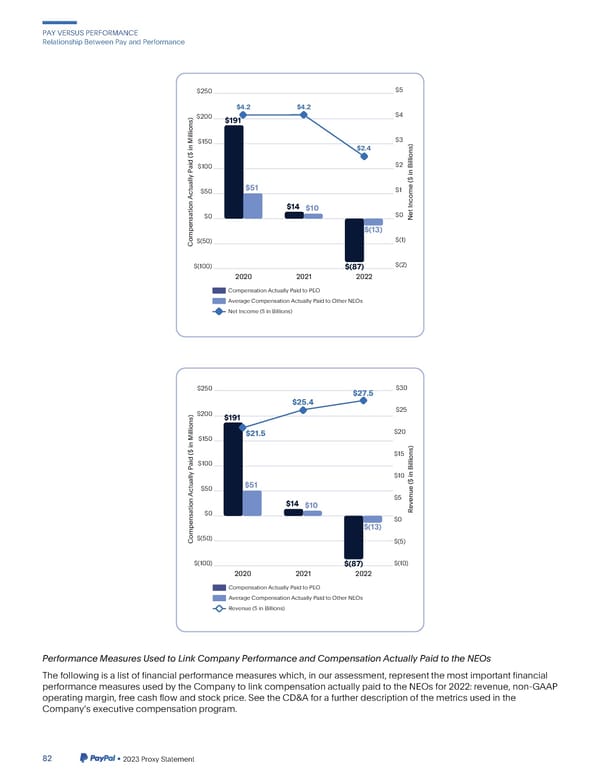
PAYVERSUSPERFORMANCE Relationship BetweenPay andPerformance $250 $5 $4.2 $4.2 $200 $191 $4 $150 $3 $2.4 $100 $2 $50 $51 $1 $14 $10 $0 $0 Net Income ($ in Billions) $(13) Compensation Actually Paid ($ in Millions) $(50) $(1) Compensation Actually Paid ($ in Millions) $(100) $(87) $(2) 2020 2021 2022 Compensation Actually Paid to PEO Average Compensation Actually Paid to Other NEOs Net Income ($ in Billions) $250 $27.5 $30 $25.4 $200 $25 $191 $21.5 $20 $150 $15 $100 $10 $50 $51 $14 $5 $10 Revenue ($ in Billions) $0 $0 $(13) Compensation Actually Paid ($ in Millions) $(50)$(5) $(100) $(87) $(10) 2020 2021 2022 Compensation Actually Paid to PEO Average Compensation Actually Paid to Other NEOs Revenue ($ in Billions) PerformanceMeasuresUsedtoLinkCompanyPerformanceandCompensationActuallyPaidtotheNEOs Thefollowingisalistoffinancialperformancemeasureswhich,inourassessment,representthemostimportantfinancial performancemeasuresusedbytheCompanytolinkcompensationactuallypaidtotheNEOsfor2022:revenue,non-GAAP operatingmargin,freecashflowandstockprice.SeetheCD&Aforafurtherdescriptionofthemetricsusedinthe Companysexecutivecompensationprogram. 82 •2023ProxyStatement
 2023 Annual Report Page 89 Page 91