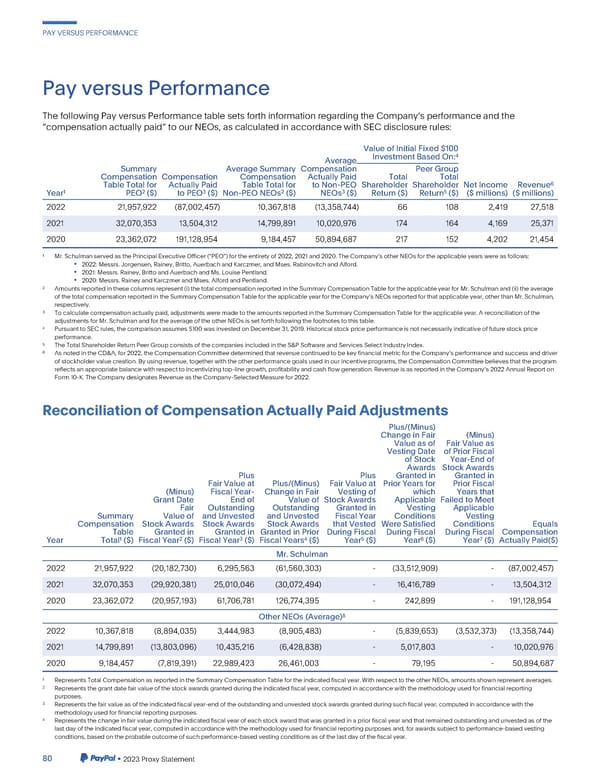
PAYVERSUSPERFORMANCE PayversusPerformance ThefollowingPayversusPerformancetablesetsforthinformationregardingtheCompanysperformanceandthe “compensationactuallypaid”toourNEOs,ascalculatedinaccordancewithSECdisclosurerules: ValueofInitialFixed$100 4 Average InvestmentBasedOn: Summary AverageSummary Compensation PeerGroup Compensation Compensation Compensation ActuallyPaid Total Total 6 TableTotalfor ActuallyPaid TableTotalfor to Non-PEO Shareholder Shareholder NetIncome Revenue 1 2 3 2 3 5 Year PEO ($) to PEO ($) Non-PEONEOs ($) NEOs ($) Return($) Return ($) ($ millions) ($ millions) 2022 21,957,922 (87,002,457) 10,367,818 (13,358,744) 66 108 2,419 27,518 2021 32,070,353 13,504,312 14,799,891 10,020,976 174 164 4,169 25,371 2020 23,362,072 191,128,954 9,184,457 50,894,687 217 152 4,202 21,454 1 Mr. SchulmanservedasthePrincipalExecutiveOfficer(“PEO”)fortheentiretyof2022,2021and2020.TheCompanysotherNEOsfortheapplicableyearswereasfollows: • 2022:Messrs.Jorgensen,Rainey,Britto,AuerbachandKarczmer,andMses.RabinovitchandAlford. • 2021:Messrs.Rainey,BrittoandAuerbachandMs.LouisePentland. • 2020:Messrs.RaineyandKarczmerandMses.AlfordandPentland. 2 Amountsreportedinthesecolumnsrepresent(i)thetotalcompensationreportedintheSummaryCompensationTablefortheapplicableyearforMr.Schulmanand(ii)theaverage of the total compensationreportedintheSummaryCompensationTablefortheapplicableyearfortheCompanysNEOsreportedforthatapplicableyear,otherthanMr.Schulman, respectively. 3 Tocalculatecompensationactuallypaid,adjustmentsweremadetotheamountsreportedintheSummaryCompensationTablefortheapplicableyear.Areconciliationofthe adjustmentsforMr.SchulmanandfortheaverageoftheotherNEOsissetforthfollowingthefootnotestothistable. 4 PursuanttoSECrules,thecomparisonassumes$100wasinvestedonDecember31,2019.Historicalstockpriceperformanceisnotnecessarilyindicativeoffuturestockprice performance. 5 TheTotalShareholderReturnPeerGroupconsistsofthecompaniesincludedintheS&PSoftwareandServicesSelectIndustryIndex. 6 AsnotedintheCD&A,for2022,theCompensationCommitteedeterminedthatrevenuecontinuedtobekeyfinancialmetricfortheCompanysperformanceandsuccessanddriver of stockholdervaluecreation.Byusingrevenue,togetherwiththeotherperformancegoalsusedinourincentiveprograms,theCompensationCommitteebelievesthattheprogram reflects an appropriate balance with respect to incentivizingtop-line growth, profitability and cash flow generation. Revenue is as reported in the Companys 2022 Annual Report on Form10-K.TheCompanydesignatesRevenueastheCompany-SelectedMeasurefor2022. ReconciliationofCompensationActuallyPaidAdjustments Plus/(Minus) ChangeinFair (Minus) Valueasof Fair Value as VestingDate ofPriorFiscal of Stock Year-Endof Awards StockAwards Plus Plus Grantedin Grantedin Fair Value at Plus/(Minus) Fair Value at Prior Years for Prior Fiscal (Minus) Fiscal Year- ChangeinFair Vestingof which Yearsthat GrantDate Endof Valueof StockAwards Applicable FailedtoMeet Fair Outstanding Outstanding Grantedin Vesting Applicable Summary Valueof andUnvested andUnvested Fiscal Year Conditions Vesting Compensation StockAwards StockAwards StockAwards that Vested WereSatisfied Conditions Equals Table Grantedin Grantedin GrantedinPrior DuringFiscal DuringFiscal DuringFiscal Compensation 1 2 3 4 5 6 7 Year Total ($) Fiscal Year ($) Fiscal Year ($) Fiscal Years ($) Year ($) Year ($) Year ($) ActuallyPaid($) Mr.Schulman 2022 21,957,922 (20,182,730) 6,295,563 (61,560,303) - (33,512,909) - (87,002,457) 2021 32,070,353 (29,920,381) 25,010,046 (30,072,494) - 16,416,789 - 13,504,312 2020 23,362,072 (20,957,193) 61,706,781 126,774,395 - 242,899 - 191,128,954 8 OtherNEOs(Average) 2022 10,367,818 (8,894,035) 3,444,983 (8,905,483) - (5,839,653) (3,532,373) (13,358,744) 2021 14,799,891 (13,803,096) 10,435,216 (6,428,838) - 5,017,803 - 10,020,976 2020 9,184,457 (7,819,391) 22,989,423 26,461,003 - 79,195 - 50,894,687 1 RepresentsTotalCompensationasreportedintheSummaryCompensationTablefortheindicatedfiscalyear.WithrespecttotheotherNEOs,amountsshownrepresentaverages. 2 Representsthegrantdatefairvalueofthestockawardsgrantedduringtheindicatedfiscalyear,computedinaccordancewiththemethodologyusedforfinancialreporting purposes. 3 Representsthefairvalueasoftheindicatedfiscalyear-endoftheoutstandingandunvestedstockawardsgrantedduringsuchfiscalyear,computedinaccordancewiththe methodologyusedforfinancialreportingpurposes. 4 Representsthechangeinfairvalueduringtheindicatedfiscalyearofeachstockawardthatwasgrantedinapriorfiscalyearandthatremainedoutstandingandunvestedasofthe last day of the indicated fiscal year, computed in accordancewith the methodologyused for financialreportingpurposes and, for awards subjectto performance-basedvesting conditions,basedontheprobableoutcomeofsuchperformance-basedvestingconditionsasofthelastdayofthefiscalyear. 80 •2023ProxyStatement
 2023 Annual Report Page 87 Page 89